build a website for free

Scenario 2

Our recommendation model 

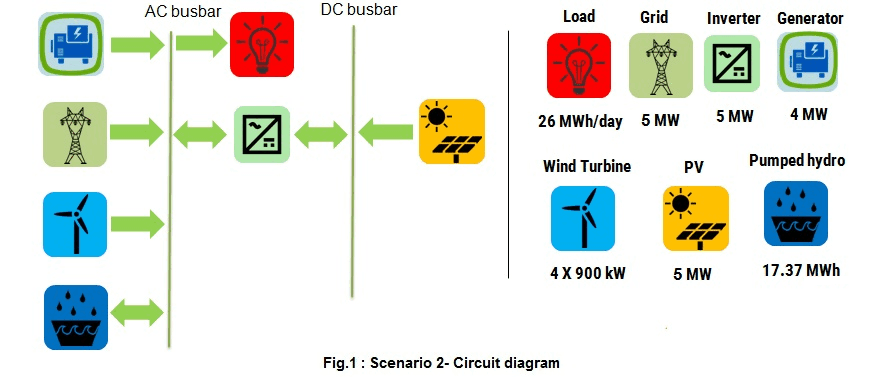
5 MW PV + 4 X 900kW WT + Pumped hydro storage hybrid system

In this scenario, as Scotland has the abundant wind resources we have used wind potential in the form of wind turbines along with the proposed solar farm. Selecting storage option was the next challenge. Even though, we tried several options like lithium-ion battery, flow battery etc., finally, we decided to use the most reliable pumped hydro storage option. The inspiration from Okinawa, Japan lead us to use the similar seawater pumped hydro at the Cumbrae as well. Later, we find out an existing reservoir at the Cumbrae which has the potential to use for the energy storage.
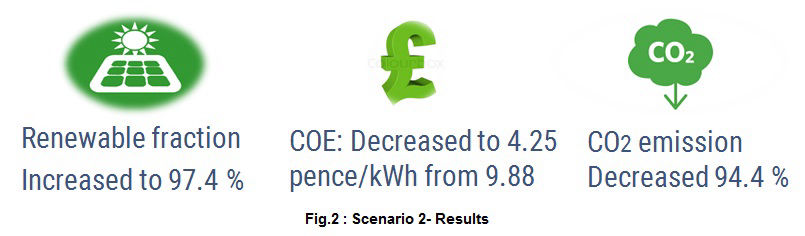
Then, as in other scenarios, the result of this combination is evaluated in terms of the renewable fraction, decrease in Cost of electricity(COE), and % of CO2 emission reduction compared with the current situation. The current COE is estimated as 9.88 pence/kWh, and current CO2 emission is calculated as 6000 tonnes/year. Also, currently the Cumbrae doesn't have any renewable generation, hence, the renewable fraction is zero. To know more about our baseline values, please click here.  

We have used 'HOMER Pro' software to design this combination. The circuit diagram that we developed to calculate the output from this Hybrid combination model is given in figure 1.                                                    

Mobirise

To know more about the circuit components please click on the respective buttons:

Pumped hydo system analysis

We visited the Cumbrae island to identify the suitable location for the seawater pumped hydro. The identified location is the existing reservoir close to golf course.
To know more about the sea water pumped hydro, and Cumbrae's site-specific reservoir information, please click here.
 
Then, we modeled the pumped hydro system in HOMER in order to understand its impact on the renewable fraction at Cumbrae. To know more about the HOMER specific inputs please click on the above pumped hydro button in the circuit diagram.

Later, in the below formula we fixed all parameters except the flow to calculate the renewable fraction for each case.
                                          Power = pgQH*efficiency

Where:
Mass density of sea water (p) = 1,028 kg/m3
Acceleration due to gravity (g) = 9.81 m/s2
Discharge through the turbine (Q) = vary m3/s
Effective head (H) = 45 meters
Pump efficiency = 90%

Also, 
Discharge duration = Volume/Flow rate (Q) 

Table 1 shows the resulted renewable fraction as result of varying Q, and finally, we selected Q as 5 m3/sec as the best because it resulted in the maximum renewable fraction.

Mobirise

Results

As a result of the above simulation model, the renewable fraction is increased to         97.4 % from the current 0% at the Cumbrae. Also, the COE is decreased to 4.25 pence/kWh from 9.88 pence/kWh. Moreover, the CO2 emission is decreased by           94.4 % compared with the current situation in the island. These results are highlighted in figure 2. The payback period of this combination is approximately around 10-12 years. Based on our analysis, the COE of the pumped hydro is 2-3 times lesser compared with the other technologies like flow battery/lithium-ion.

Mobirise

Typical period in a year

As we used both solar and wind in this scenario, the characteristics of the renewable generation is almost same for the entire year. Hence, we are representing only one typical period in the year to understand the behavior of the components. Figure 3 shows a period in the month of February. 

Mobirise


The above curve shows pumped hydro charging and discharging with respect to the electricity demand and renewable output.

Pumped hydro charging : 
Pump hydro charging occurs in the periods of high renewable output and low electricity demand. Thus, the system uses the surplus energy to pump water to store in the reservoir.
Pumped hydro discharging : 
In contrast to the charging period, pumped hydro discharge periods happen when renewable output is lower than the electricity demand. Therefore, the reservoir is opened and allows the water to pass through the turbine to generate electricity to meet the energy demand.  Hence, the electricity purchase from the grid is avoided during this deficit period.
Grid purchase : 
However, the generation from the renewables and storage was not enough to meet the demand without grid purchase for the entire year. This case occurs when renewable output is lower than the electricity demand and also, there is insufficient water in the reservoir to produce the power. In this situation, we need to import the electricity from the grid to meet the demand.

In total, the overall percentage of grid sales, grid purchase, and renewables outputs for a year is given below:

Grid sales : 50 %
Grid purchase: 2.74 %
PV output: 22.8 %
Wind output: 74.5 %

The state of charging of pumped hydro is given in figure 4. In the graph, it is shown that during our peak winter periods (Jan and Dec) the maximum state of charging (the pumped water level in the reservoir) is only close to 60-70 % compared with the other months(100%).  In addition, during the winter periods(Nov to Mar), the reservoir storage at its minimum level (10%) or close to it, compared with the summer periods.

Mobirise

Address

Department of Mechanical & Aerospace Engineering,  James Weir Building, Level 8,  
75 Montrose Street
Glasgow G1 1XJ
Scotland, UK


Reach us at : 

Contact us